
Learn Python – Python web scraping of IPL point table and graph plotting using python libraries
Here is how point table exactly looks like on cricbuzz website.
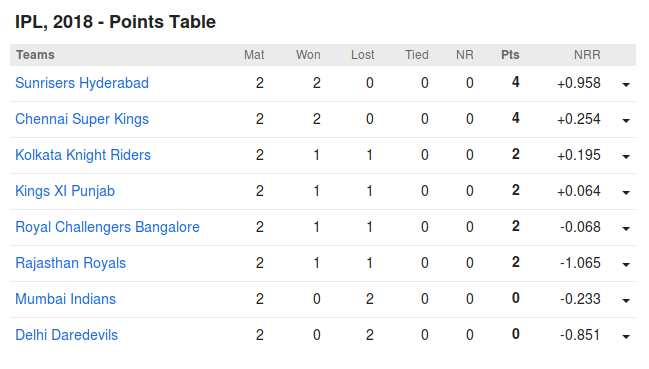
We try to extract points table along with header and Teams and store these values in DataFrame and we use the matplotlib library of python to plot a bar graph that will demonstrate the Won and lost count of team.
This code dynamically pull in data from cricbuzz so it doesn’t matter whenever you execute the below code with Internet connection it will give you correct information. Also make sure that you install all necessary packages before execution of code.
1 | <br />from bs4 import BeautifulSoup<br />import numpy as np<br />import pandas as pd<br />import matplotlib.pyplot as plt<br />import requests<br /><br />page = requests.get("http://www.cricbuzz.com/cricket-series/2676/indian-premier-league-2018/points-table")<br /><br />soup = BeautifulSoup(page.text)<br />#print(soup.prettify())<br /><br />tbl = soup.find("table",class_="table cb-srs-pnts")<br />#print(tbl.prettify())<br /><br />col_names = [x.get_text() for x in tbl.find_all('td',class_="cb-srs-pnts-th")]<br />col_names[5]='pts'<br />#print(col_names)<br /><br />team_names = [x.get_text() for x in tbl.find_all('td',class_="cb-srs-pnts-name")]<br />#print(team_names)<br /><br />pnt_tbl = [x.get_text() for x in tbl.find_all('td',class_="cb-srs-pnts-td")]<br />#print(pnt_tbl)<br /><br />np_pnt_tbl = (np.array(pnt_tbl)).reshape(len(team_names),7)<br />np_pnt_tbl = np.delete(np_pnt_tbl,6,1)<br />np_pnt_tbl = np_pnt_tbl.astype(int)<br />#print(np_pnt_tbl)<br /><br />consol_tbl = pd.DataFrame(np_pnt_tbl,index=team_names,columns=col_names)<br />consol_tbl.columns.name = "Teams"<br />print(consol_tbl)<br /><br />team_abr = []<br /><br />for team in team_names:<br /> short_form = ''<br /> for initial in team.split(' '):<br /> short_form = short_form + initial[0]<br /> team_abr.append(short_form)<br /><br /><br />title = 'IPL 2018 Number of match won by teams'<br />val_ticks = [1,2,3,4,5,6,7,8]<br />lost_ticks=[1.4,2.4,3.4,4.4,5.4,6.4,7.4,8.4]<br /><br /><br />plt.bar(val_ticks,np_pnt_tbl[:,1],width=0.4,color='g',alpha=0.6,label='Won')<br />plt.bar(lost_ticks,np_pnt_tbl[:,2],width=0.4,color='r',alpha=0.6,label='Lost')<br />plt.yticks(val_ticks)<br />plt.ylabel("Matches")<br />plt.xticks(val_ticks,team_names,rotation='vertical')<br />plt.grid(True)<br />plt.legend()<br />plt.title(title)<br /><br />plt.show()<br /><br /> |
This screenshots or just for better understanding though the IPL status keep changing output will also change. For exact output copy the code above and try on your own once, it will be fun.
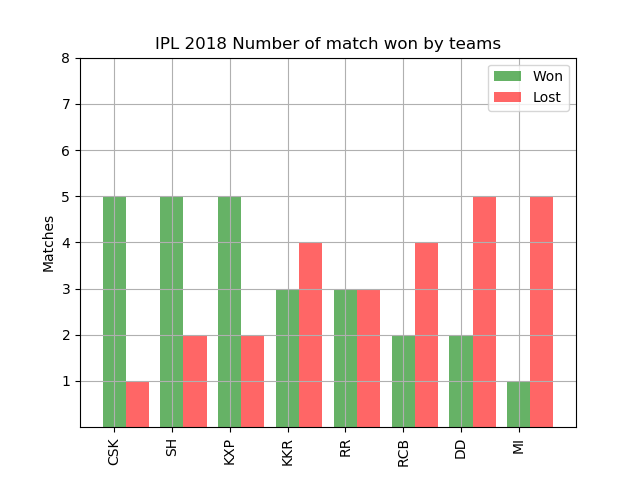 |
| bar graph |
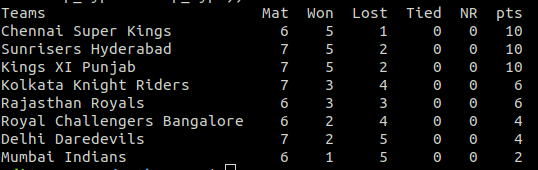 |
| point table |
Note: I hope this will help you as a reference or as a motivation to extract some useful information that are available through out the Internet for use and help you in your good executions.